Humax busy while "idle"

My Humax4 is running slow.
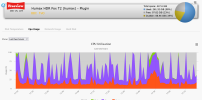
While decrypting last nights "The Last of the Mohicans" and then detecting adverts, sysmon gui showed ~40% system and 54% user (6% idle).
Now complete it idles at system ~41% and user ~30% (29% idle).
The box is on Freeview LCN:100 and not recording.

Any ideas how I can diagnose what is busy before I reboot (to see if it fixes it). I want too see if I can fix this if it happens again but recording.

Attached pic.
cap chart - Humax4 high CPU 20240308.jpg
 
Last edited:
You can run top -c from a telnet session to see what is currently using the cpu. 100% would be normal while running detectads
My sysmon is very spikey even when doing not much
Code:
humax /mnt/hd2/mod/git # top -c
top - 14:23:46 up  3:11,  0 users,  load average: 2.15, 2.03, 1.88
Tasks:  71 total,   1 running,  70 sleeping,   0 stopped,   0 zombie
Cpu(s):  9.0%us, 10.8%sy,  4.3%ni, 74.5%id,  1.1%wa,  0.2%hi,  0.2%si,  0.0%st
Mem:    125016k total,   109968k used,    15048k free,    17148k buffers
Swap:   131064k total,      204k used,   130860k free,    44272k cached

  PID USER      PR  NI  VIRT  RES  SHR S %CPU %MEM    TIME+  COMMAND
  408 root      18   0  341m  39m  15m S   30 32.7  61:55.50 /usr/bin/humaxtv
16633 root      26  10  1284  628  480 R    2  0.5   0:00.33 top -c
 1500 root      26  10  6228 1488  740 S    1  1.2   0:14.29 /mod/sbin/lighttpd
 2041 root      35  10  1268  452  376 S    0  0.4   2:08.08 /bin/sh /mod/sbin/s
 1068 root      11  -5     0    0    0 S    0  0.0   0:31.63 [kjournald]
    2 root      RT   0     0    0    0 S    0  0.0   0:01.15 [migration/0]
    1 root      15   0  1256  396  340 S    0  0.3   0:02.58 init
    6 root      10  -5     0    0    0 S    0  0.0   0:00.10 [events/0]
    3 root      39  19     0    0    0 S    0  0.0   0:00.01 [ksoftirqd/0]
    5 root      34  19     0    0    0 S    0  0.0   0:00.01 [ksoftirqd/1]
   10 root      10  -5     0    0    0 S    0  0.0   0:02.04 [kblockd/0]
   11 root      13  -5     0    0    0 S    0  0.0   0:00.63 [kblockd/1]
   13 root      10  -5     0    0    0 S    0  0.0   0:00.00 [kseriod]
   14 root      15   0     0    0    0 S    0  0.0   0:08.72 [pdflush]
   15 root      15   0     0    0    0 S    0  0.0   0:10.10 [pdflush]
   16 root      10  -5     0    0    0 S    0  0.0   0:10.66 [kswapd0]
    4 root      RT   0     0    0    0 S    0  0.0   0:01.09 [migration/1]
1709908039971.png

I would start out with running fixdisk in maintenance mode to rule out/resolve disk problem - a single bad sector in a key file can cause a general slow down.

Also the humaxtv process can get stuck trying to process problem recordings, zero length or undecryptable files.
Try the tests listed here to see if there are potential problem recordings
 
Thank you MymsMan for your helpful reply.
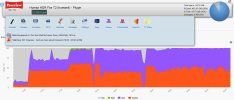
There seems to be problem decrypting or detecting adverts - very slow.
Copying to another Humax seems normal, over 50Mbps (although usually over 60Mbps but this was occurring at the same time).

Having problems inserting an image (interface leaving stuff behind!)

H4 - CPU usage graph.JPG

top -c
Code:
19:27 08-03-2024    Humax4 > top -c

top - 19:26:30 up  5:51,  0 users,  load average: 6.40, 6.21, 6.00
Tasks:  65 total,   3 running,  62 sleeping,   0 stopped,   0 zombie
Cpu(s):  8.0%us, 53.3%sy, 37.8%ni,  1.0%id,  0.0%wa,  0.0%hi,  0.0%si,  0.0%st
Mem:    125016k total,   121796k used,     3220k free,     5168k buffers
Swap:   131064k total,      636k used,   130428k free,    68024k cached

  PID USER      PR  NI  VIRT  RES  SHR S %CPU %MEM    TIME+  COMMAND
  374 root      25   0  341m  40m  16m S   25 33.1  83:39.22 /usr/bin/humaxtv
 2333 root      39  19 35204 7772 4400 R   20  6.2  19:40.87 ffmpeg -nostats -loglevel fatal -i /mnt/hd2/My Video/The Sea Shall Not Have Them_20240308_1610.ts -vn
24850 root      35  10  1304  528  408 S    7  0.4   1:58.32 /bin/sh /var/lib/humaxtv_backup/mod/tmenu
 8589 root      35  10  1304  536  416 S    7  0.4   7:37.30 /bin/sh /var/lib/humaxtv_backup/mod/tmenu
 2334 root      26  10  2608  904  732 S    4  0.7   3:41.97 /mod/webif/plugin/detectads/silence 0 -70 0.2 3 60 90 0
 8265 root      26  10  1288  632  480 R    3  0.5   0:00.35 top -c
 1821 root      35  10  1264  456  380 S    1  0.4   2:08.47 /bin/sh /mod/sbin/scanmounts
 1606 root      26  10  5464 1548  752 S    1  1.2   1:12.87 /mod/sbin/lighttpd -f /mod/etc/lighttpd/server.conf
  166 root      25  10   816  184  136 S    0  0.1   0:02.50 /sbin/utelnetd -l /bin/tmenu -p 23 -d -B
    2 root      RT   0     0    0    0 S    0  0.0   0:02.88 [migration/0]
    5 root      34  19     0    0    0 S    0  0.0   0:00.00 [ksoftirqd/1]
    6 root      10  -5     0    0    0 S    0  0.0   0:00.32 [events/0]
    8 root      10  -5     0    0    0 S    0  0.0   0:00.00 [khelper]
   13 root      10  -5     0    0    0 S    0  0.0   0:00.00 [kseriod]
    1 root      18   0  1252  396  340 S    0  0.3   0:02.80 init
   12 root      10  -5     0    0    0 S    0  0.0   0:00.00 [khubd]
    4 root      RT   0     0    0    0 S    0  0.0   0:02.97 [migration/1]
   18 root      10  -5     0    0    0 S    0  0.0   0:00.00 [aio/1]
    7 root      10  -5     0    0    0 S    0  0.0   0:00.05 [events/1]
   20 root      12  -5     0    0    0 S    0  0.0   0:00.00 [ata/1]
   21 root      10  -5     0    0    0 S    0  0.0   0:00.01 [ata_aux]
    9 root      11  -5     0    0    0 S    0  0.0   0:00.00 [kthread]
   19 root      11  -5     0    0    0 S    0  0.0   0:00.00 [ata/0]
   24 root      15   0     0    0    0 S    0  0.0   0:27.84 [mtdblockd]
   25 root      11  -5     0    0    0 S    0  0.0   0:00.00 [kpsmoused]
   26 root      20   0  1244  408  364 S    0  0.3   0:00.04 /bin/sh /etc/init.d/rcS
   87 root      26  10     0    0    0 S    0  0.0   0:00.34 [jffs2_gcd_mtd1]
   88 root      26  10     0    0    0 S    0  0.0   0:00.08 [jffs2_gcd_mtd2]
    3 root      34  19     0    0    0 S    0  0.0   0:00.01 [ksoftirqd/0]
   17 root      20  -5     0    0    0 S    0  0.0   0:00.00 [aio/0]
  275 root      16  -5     0    0    0 S    0  0.0   0:00.00 [file-storage-ga]
  292 root      20   0  1260  452  380 S    0  0.4   0:00.25 /bin/sh /etc/init.d/S90settop start
  311 root      13  -5     0    0    0 S    0  0.0   0:00.00 [scsi_eh_2]
  312 root      16  -5     0    0    0 S    0  0.0   0:00.00 [usb-storage]
   22 root      10  -5     0    0    0 S    0  0.0   0:00.00 [scsi_eh_0]
  990 root      17  -5     0    0    0 S    0  0.0   0:00.32 [kjournald]
 1339 root      10  -5     0    0    0 S    0  0.0   0:54.17 [kjournald]

I'm currently running a fixdisk after waiting over 1 1/2hrs for ad-detection to complete and giving up,
 
fixdisk log...was slow at ~62%

Code:
20:23 08-03-2024    Humax4

Menu version 1.24
Enter system PIN: ****

      /---------------------------------------------\
      |  M A I N T E N A N C E   M O D E   M E N U  |
      \---------------------------------------------/

  [ Humax HDR-Fox T2 (humax4) 1.03.12/3.13 ]

 fixdisk - Check and repair hard disk.
   short - Run short hard-disk self test.
    long - Run long hard-disk self test.
   check - Check self-test progress.
    gptf - Re-format disk using GPT scheme.
     epg - Clear persistent EPG data.
    dlna - Reset DLNA server database.
       x - Leave maintenance mode (Humax will restart).
    diag - Run a diagnostic.
     cli - System command line (advanced users).

Please select option: fixdisk
Any additional options (-h for list or press return for none):
Are you sure you wish to run the hard disk checker? [Y/N] y
Running /bin/fix-disk

Checking disk sda (512 byte sectors)

Unmounted /dev/sda1
Unmounted /dev/sda2
Unmounted /dev/sda3


Running short disk self test

No pending sectors found - skipping sector repair

Checking partition tables...

MBR Status: MBR only
GPT Status: not present

Using superblock 0 on sda1
Using superblock 0 on sda2
Using superblock 0 on sda3


Fri Mar  8 19:44:46 GMT 2024: Checking partition /dev/sda3...
e2fsck 1.42.13 (17-May-2015)
Pass 1: Checking inodes, blocks, and sizes
☻Pass 1: Memory used: 240k/0k (157k/84k), time:  6.42/ 2.04/ 2.40
Pass 1: I/O read: 163MB, write: 0MB, rate: 25.39MB/s
Pass 2: Checking directory structure
Pass 2: Memory used: 340k/0k (260k/81k), time:  0.02/ 0.00/ 0.01
Pass 2: I/O read: 1MB, write: 0MB, rate: 47.19MB/s
Pass 3: Checking directory connectivity
Peak memory: Memory used: 340k/0k (260k/81k), time:  6.99/ 2.31/ 2.45
Pass 3A: Memory used: 340k/0k (260k/81k), time:  0.00/ 0.00/ 0.00
Pass 3A: I/O read: 0MB, write: 0MB, rate: 0.00MB/s
Pass 3: Memory used: 340k/0k (259k/82k), time:  0.01/ 0.00/ 0.00
Pass 3: I/O read: 0MB, write: 0MB, rate: 0.00MB/s
Pass 4: Checking reference counts
☻Pass 4: Memory used: 340k/0k (54k/287k), time:  0.98/ 0.97/ 0.00
Pass 4: I/O read: 0MB, write: 0MB, rate: 0.00MB/s
Pass 5: Checking group summary information
☻Pass 5: Memory used: 340k/0k (53k/287k), time:  2.75/ 1.96/ 0.04
Pass 5: I/O read: 1MB, write: 0MB, rate: 0.36MB/s

          20 inodes used (0.00%, out of 655776)
           5 non-contiguous files (25.0%)
           0 non-contiguous directories (0.0%)
             # of inodes with ind/dind/tind blocks: 2/2/0
      122668 blocks used (4.68%, out of 2622611)
           0 bad blocks
           1 large file

           9 regular files
           2 directories
           0 character device files
           0 block device files
           0 fifos
           0 links
           0 symbolic links (0 fast symbolic links)
           0 sockets
------------
          11 files
Memory used: 340k/0k (53k/287k), time: 10.77/ 5.23/ 2.50
I/O read: 165MB, write: 1MB, rate: 15.32MB/s
Fri Mar  8 19:44:58 GMT 2024

Fri Mar  8 19:44:58 GMT 2024: Checking partition /dev/sda1...
e2fsck 1.42.13 (17-May-2015)
Pass 1: Checking inodes, blocks, and sizes
☻Pass 1: Memory used: 140k/0k (62k/79k), time:  0.74/ 0.22/ 0.42
Pass 1: I/O read: 17MB, write: 0MB, rate: 22.83MB/s
Pass 2: Checking directory structure
Pass 2: Memory used: 140k/0k (72k/69k), time:  0.02/ 0.00/ 0.00
Pass 2: I/O read: 1MB, write: 0MB, rate: 42.98MB/s
Pass 3: Checking directory connectivity
Peak memory: Memory used: 140k/0k (72k/69k), time:  0.90/ 0.25/ 0.43
Pass 3A: Memory used: 140k/0k (72k/69k), time:  0.00/ 0.00/ 0.00
Pass 3A: I/O read: 0MB, write: 0MB, rate: 0.00MB/s
Pass 3: Memory used: 140k/0k (71k/70k), time:  0.00/ 0.00/ 0.00
Pass 3: I/O read: 0MB, write: 0MB, rate: 0.00MB/s
Pass 4: Checking reference counts
☻Pass 4: Memory used: 140k/0k (50k/91k), time:  0.10/ 0.10/ 0.00
Pass 4: I/O read: 0MB, write: 0MB, rate: 0.00MB/s
Pass 5: Checking group summary information
☻Pass 5: Memory used: 140k/0k (50k/91k), time:  0.32/ 0.25/ 0.01
Pass 5: I/O read: 1MB, write: 0MB, rate: 3.17MB/s

          14 inodes used (0.02%, out of 65808)
           1 non-contiguous file (7.1%)
           0 non-contiguous directories (0.0%)
             # of inodes with ind/dind/tind blocks: 2/1/0
       14555 blocks used (5.53%, out of 263064)
           0 bad blocks
           1 large file

           2 regular files
           3 directories
           0 character device files
           0 block device files
           0 fifos
           0 links
           0 symbolic links (0 fast symbolic links)
           0 sockets
------------
           5 files
Memory used: 140k/0k (50k/91k), time:  1.34/ 0.60/ 0.44
I/O read: 17MB, write: 1MB, rate: 12.73MB/s
Fri Mar  8 19:44:59 GMT 2024

Creating swap file...
Setting up swapspace version 1, size = 1073737728 bytes
UUID=f72c3a32-8d68-460f-b0c3-9de5bd2e564f

Fri Mar  8 19:45:22 GMT 2024: Checking partition /dev/sda2...
e2fsck 1.42.13 (17-May-2015)
Pass 1: Checking inodes, blocks, and sizes
☻Pass 1: Memory used: 1004k/4676k (525k/480k), time: 2079.00/1177.60/87.76
Pass 1: I/O read: 7706MB, write: 0MB, rate: 3.71MB/s
Pass 2: Checking directory structure
☻Pass 2: Memory used: 1004k/9352k (484k/521k), time:  4.12/ 1.07/ 0.24
Pass 2: I/O read: 5MB, write: 0MB, rate: 1.21MB/s
Pass 3: Checking directory connectivity
Peak memory: Memory used: 1004k/9352k (485k/520k), time: 2101.67/1196.53/88.05
Pass 3A: Memory used: 1004k/9352k (501k/504k), time:  0.00/ 0.00/ 0.00
Pass 3A: I/O read: 0MB, write: 0MB, rate: 0.00MB/s
Pass 3: Memory used: 1004k/9352k (474k/531k), time:  0.09/ 0.06/ 0.01
Pass 3: I/O read: 1MB, write: 0MB, rate: 11.15MB/s
Pass 4: Checking reference counts
☻Pass 4: Memory used: 1004k/0k (360k/645k), time: 45.89/45.28/ 0.04
Pass 4: I/O read: 0MB, write: 0MB, rate: 0.00MB/s
Pass 5: Checking group summary information
☻Pass 5: Memory used: 1004k/0k (344k/661k), time: 121.51/90.33/ 1.15
Pass 5: I/O read: 29MB, write: 0MB, rate: 0.24MB/s

       13129 inodes used (0.04%, out of 29860704)
        1432 non-contiguous files (10.9%)
          29 non-contiguous directories (0.2%)
             # of inodes with ind/dind/tind blocks: 1869/738/0
   107745867 blocks used (90.38%, out of 119209984)
           0 bad blocks
          33 large files

       11673 regular files
         868 directories
           2 character device files
           0 block device files
           0 fifos
          28 links
         577 symbolic links (570 fast symbolic links)
           0 sockets
------------
       13148 files
Memory used: 1004k/0k (344k/661k), time: 2269.33/1332.20/89.24
I/O read: 7740MB, write: 1MB, rate: 3.41MB/s
Fri Mar  8 20:23:12 GMT 2024
Removing extra swap space.

Finished
fix-disk: session terminated with exit status 0

Press return to continue:
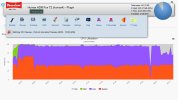
 
Diagnosing this is way above my pay grade but..... I have a strong suspicion that the fact that your disk is 90% full may have a quite a lot to do with the problem.

Disks that are close to full can be erratic, flakey and slow.
If it were mine I would want to copy or delete around 50 to 100GB of recordings, leaving the disk with at least 25% free space.

If that seems to help I would look into restricting auto-processing to hours when the box is not used for viewing.
It is easy to wake the box overnight for an hour and use that time to do all the decrypting, shrinking etc.
 
Back
Top