Spurious disk full message

MymsMan

Ad detector
Today while watching a programme whilst it was recording I received an on screen popup saying "Recording stopped - HDD full" (or words to that affect) and the recording status shows as "Valid/Incomplete: Disk was full" but the disk has 88GiB free space and the file system hasn't gone Read-Only - subsequent programmes are recording normally.

Any idea on cause and how to prevent (I have seen it happen before)?

I will run a fix-disk when I get a suitable gap in the recording schedule

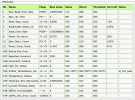
Current disk stats are:
1730470719717.png
 
Fixdisk didn't find any problems !
Code:
Creating swap file...                                                                                                                       
Setting up swapspace version 1, size = 1073737728 bytes                                                                                     
UUID=d6a4ebb4-2e4c-4352-ac62-0bf6c733e011                                                                                                   
                                                                                                                                            
Fri Nov  1 15:09:09 GMT 2024: Checking partition /dev/sda2...                                                                               
e2fsck 1.42.13 (17-May-2015)                                                                                                               
Pass 1: Checking inodes, blocks, and sizes                                                                                                 
Pass 1: Memory used: 1556k/4696k (1149k/408k), time: 1890.54/1109.55/88.78                                                                 
Pass 1: I/O read: 7665MB, write: 0MB, rate: 4.05MB/s                                                                                       
Pass 2: Checking directory structure                                                                                                       
Pass 2: Memory used: 1556k/9392k (1011k/546k), time: 13.73/ 3.18/ 0.75                                                                     
Pass 2: I/O read: 17MB, write: 0MB, rate: 1.24MB/s                                                                                         
Pass 3: Checking directory connectivity                                                                                                     
Peak memory: Memory used: 1556k/9392k (1011k/546k), time: 1922.77/1130.59/89.59                                                             
Pass 3A: Memory used: 1556k/9392k (1060k/497k), time:  0.00/ 0.00/ 0.00                                                                   
Pass 3A: I/O read: 0MB, write: 0MB, rate: 0.00MB/s                                                                                         
Pass 3: Memory used: 1556k/9392k (967k/590k), time:  0.32/ 0.25/ 0.02                                                                       
Pass 3: I/O read: 1MB, write: 0MB, rate: 3.17MB/s                                                                                           
Pass 4: Checking reference counts                                                                                                           
Pass 4: Memory used: 1556k/0k (659k/898k), time: 45.97/45.39/ 0.05                                                                         
Pass 4: I/O read: 0MB, write: 0MB, rate: 0.00MB/s                                                                                           
Pass 5: Checking group summary information                                                                                                 
Pass 5: Memory used: 1556k/0k (610k/947k), time: 119.71/89.82/ 1.19                                                                       
Pass 5: I/O read: 29MB, write: 0MB, rate: 0.24MB/s                                                                                         
                                                                                                                                            
       34427 inodes used (0.12%, out of 29860704)
        1924 non-contiguous files (5.6%)                                                                                                   
          31 non-contiguous directories (0.1%)                                                                                             
             # of inodes with ind/dind/tind blocks: 2837/410/4                                                                             
    96537214 blocks used (80.98%, out of 119209984)                                                                                         
           0 bad blocks                                                                                                                     
          25 large files                                                                                                                   
                                                                                                                                            
       29499 regular files                                                                                                                 
        3719 directories                                                                                                                   
          90 character device files                                                                                                         
         112 block device files                                                                                                             
           1 fifo                                                                                                                           
         563 links                                                                                                                         
         994 symbolic links (964 fast symbolic links)                                                                                       
           3 sockets                                                                                                                       
------------                                                                                                                               
       34981 files                                                                                                                         
Memory used: 1556k/0k (610k/947k), time: 2088.90/1266.05/90.86                                                                             
I/O read: 7712MB, write: 1MB, rate: 3.69MB/s                                                                                               
Fri Nov  1 15:43:59 GMT 2024                                                                                                               
Removing extra swap space.                                                                                                                 
                                                                                                                                            
Finished
 
The Humax black box is known to respond to situations not anticipated by the programmers with misleading messages (and potentially actions). In a case where the CF is active, for example, we know the standard firmware gets confused and claims a HDD can't be formatted because it's too big (when it isn't). I believe the reason for that is such situation was never expected and never taken into account.

You observation in the first post seems to have no explanation, but might simply be the result of a disk status which is outside the expected variations. You don't mention whether this is the standard OEM HDD or another model.
 
Maybe you've hit a preset or hard coded limit of some sort?
Were there file deletions since the recording? If so, was the drive nearly full during the recording?
Is it a 500GB drive?
I've not seen the message myself. I'll include the results of my last fixdisk runs for comparison.
On one of mine (with 4TB drive) it has this
Code:
Fri Jul  5 06:02:37 BST 2024: Checking partition /dev/sda2...
Pass 1: Checking inodes, blocks, and sizes
Pass 1: I/O read: 3849MB, write: 0MB, rate: 0.25MB/s
Pass 2: Checking directory structure
Pass 2: I/O read: 8MB, write: 0MB, rate: 0.74MB/s
Pass 3: Checking directory connectivity
Peak memory: Memory used: 3468k/936k (2631k/838k), time: 15678.02/8404.77/169.43
Pass 3A: I/O read: 0MB, write: 0MB, rate: 0.00MB/s
Pass 3: Memory used: 3468k/936k (2614k/855k), time:  0.19/ 0.16/ 0.01
Pass 3: I/O read: 1MB, write: 0MB, rate: 5.14MB/s
Pass 4: Checking reference counts
Pass 4: I/O read: 0MB, write: 0MB, rate: 0.00MB/s
Pass 5: Checking group summary information
Pass 5: I/O read: 233MB, write: 0MB, rate: 0.82MB/s

       30893 inodes used (0.81%, out of 3804288)
        4751 non-contiguous files (15.4%)
          43 non-contiguous directories (0.1%)
             # of inodes with ind/dind/tind blocks: 8846/4343/58
   755856449 blocks used (77.61%, out of 973870801)
           0 bad blocks
         186 large files

       28836 regular files
        1455 directories
           2 character device files
           0 block device files
           0 fifos
          42 links
         591 symbolic links (591 fast symbolic links)
           0 sockets
------------
       30926 files
Memory used: 3468k/936k (1103k/2366k), time: 15968.77/8455.77/183.85
I/O read: 4090MB, write: 1MB, rate: 0.26MB/s
Fri Jul  5 10:28:47 BST 2024
Removing extra swap space.

----------------------------------------------------------------------
Fri Jul  5 10:28:49 BST 2024: Fix-disk run ended.
----------------------------------------------------------------------
On the other (with 2TB drive) it has
Code:
Thu Dec 9 05:20:13 GMT 2021: Checking partition /dev/sda2...
Pass 1: Checking inodes, blocks, and sizes
Pass 1: I/O read: 858MB, write: 0MB, rate: 0.51MB/s
Pass 2: Checking directory structure
Pass 2: I/O read: 11MB, write: 0MB, rate: 1.72MB/s
Pass 3: Checking directory connectivity
Peak memory: Memory used: 1820k/468k (1595k/226k), time: 1703.03/1029.65/31.05
Pass 3A: I/O read: 0MB, write: 0MB, rate: 0.00MB/s
Pass 3: Memory used: 1820k/468k (1581k/240k), time: 0.12/ 0.09/ 0.01
Pass 3: I/O read: 1MB, write: 0MB, rate: 8.54MB/s
Pass 4: Checking reference counts
Pass 4: I/O read: 0MB, write: 0MB, rate: 0.00MB/s
Pass 5: Checking group summary information
Pass 5: I/O read: 116MB, write: 0MB, rate: 0.75MB/s

       29983 inodes used (1.58%, out of 1896576)
         731 non-contiguous files (2.4%)
          31 non-contiguous directories (0.1%)
             # of inodes with ind/dind/tind blocks: 1962/580/4
   100664893 blocks used (20.73%, out of 485494801)
           0 bad blocks
          27 large files

       25953 regular files
        1203 directories
           4 character device files
           0 block device files
           0 fifos
          17 links
        2814 symbolic links (2812 fast symbolic links)
           0 sockets
------------
       29991 files
Memory used: 1820k/468k (847k/974k), time: 1862.28/1056.41/38.39
I/O read: 985MB, write: 1MB, rate: 0.53MB/s
Thu Dec 9 05:51:16 GMT 2021
Removing extra swap space.

----------------------------------------------------------------------
Thu Dec 9 05:51:18 GMT 2021: Fix-disk run ended.
----------------------------------------------------------------------
 
Last edited:
You observation in the first post seems to have no explanation, but might simply be the result of a disk status which is outside the expected variations. You don't mention whether this is the standard OEM HDD or another model.
It is the original 500GB disk, CF auto processing was not active at the time and Detectads wasn't running (BBC recording) and it was 36minutes into the recording so not something caused by recording start/end.
The most obvious cause would be some sort of write error being misinterpreted as disk full but fixdisk didn't detect problems
 
Maybe you've hit a preset or hard coded limit of some sort?
Were there file deletions since the recording? If so, was the drive nearly full during the recording?
20% free, no file deletions, empty_dustbin ran at 02:08, at times I have run much closer to disk full
 
Does the SMART show anything in the error log?
smartctl -a /dev/sda below the stats.
Otherwise I think you have to put it down to some weird transient thing that you'll never get to the bottom of.
 
I am not sure whether this tells us anything useful - errors seem to be all reported at power up
Code:
smartctl -a  /dev/sdb
smartctl 6.4 2015-06-04 r4109 [7405b0-smp-linux-2.6.18-7.1] (local build)
Copyright (C) 2002-15, Bruce Allen, Christian Franke, www.smartmontools.org

=== START OF INFORMATION SECTION ===
Model Family:     Seagate Pipeline HD 5900.2
Device Model:     ST3500312CS
Serial Number:    5VV8SNPP
LU WWN Device Id: 5 000c50 0450b8605
Firmware Version: SC13
User Capacity:    500,107,862,016 bytes [500 GB]
Sector Size:      512 bytes logical/physical
Rotation Rate:    5900 rpm
Device is:        In smartctl database [for details use: -P show]
ATA Version is:   ATA8-ACS T13/1699-D revision 4
SATA Version is:  SATA 2.6, 3.0 Gb/s (current: 3.0 Gb/s)
Local Time is:    Fri Nov  1 22:39:41 2024 GMT
SMART support is: Available - device has SMART capability.
SMART support is: Enabled

=== START OF READ SMART DATA SECTION ===
SMART overall-health self-assessment test result: PASSED
See vendor-specific Attribute list for marginal Attributes.

General SMART Values:
Offline data collection status:  (0x00) Offline data collection activity
                                        was never started.
                                        Auto Offline Data Collection: Disabled.
Self-test execution status:      (   0) The previous self-test routine completed
                                        without error or no self-test has ever
                                        been run.
Total time to complete Offline
data collection:                (  623) seconds.
Offline data collection
capabilities:                    (0x73) SMART execute Offline immediate.
                                        Auto Offline data collection on/off support.
                                        Suspend Offline collection upon new
                                        command.
                                        No Offline surface scan supported.
                                        Self-test supported.
                                        Conveyance Self-test supported.
                                        Selective Self-test supported.
SMART capabilities:            (0x0003) Saves SMART data before entering
                                        power-saving mode.
                                        Supports SMART auto save timer.
Error logging capability:        (0x01) Error logging supported.
                                        General Purpose Logging supported.
Short self-test routine
recommended polling time:        (   1) minutes.
Extended self-test routine
recommended polling time:        ( 108) minutes.
Conveyance self-test routine
recommended polling time:        (   2) minutes.
SCT capabilities:              (0x103b) SCT Status supported.
                                        SCT Error Recovery Control supported.
                                        SCT Feature Control supported.
                                        SCT Data Table supported.

SMART Attributes Data Structure revision number: 10
Vendor Specific SMART Attributes with Thresholds:
ID# ATTRIBUTE_NAME          FLAG     VALUE WORST THRESH TYPE      UPDATED  WHEN_FAILED RAW_VALUE
  1 Raw_Read_Error_Rate     0x000f   114   088   006    Pre-fail  Always       -       76785431
  3 Spin_Up_Time            0x0003   097   097   000    Pre-fail  Always       -       0
  4 Start_Stop_Count        0x0032   078   078   020    Old_age   Always       -       22689
  5 Reallocated_Sector_Ct   0x0033   100   100   036    Pre-fail  Always       -       0
  7 Seek_Error_Rate         0x000f   090   060   030    Pre-fail  Always       -       1036983041
  9 Power_On_Hours          0x0032   028   028   000    Old_age   Always       -       63737
 10 Spin_Retry_Count        0x0013   100   100   097    Pre-fail  Always       -       0
 12 Power_Cycle_Count       0x0032   089   089   020    Old_age   Always       -       11346
184 End-to-End_Error        0x0032   100   100   099    Old_age   Always       -       0
187 Reported_Uncorrect      0x0032   001   001   000    Old_age   Always       -       2052
188 Command_Timeout         0x0032   100   100   000    Old_age   Always       -       0
189 High_Fly_Writes         0x003a   100   100   000    Old_age   Always       -       0
190 Airflow_Temperature_Cel 0x0022   059   042   045    Old_age   Always   In_the_past 41 (Min/Max 35/41 #24702)
194 Temperature_Celsius     0x0022   041   058   000    Old_age   Always       -       41 (0 16 0 0 0)
195 Hardware_ECC_Recovered  0x001a   048   027   000    Old_age   Always       -       76785431
197 Current_Pending_Sector  0x0012   100   100   000    Old_age   Always       -       0
198 Offline_Uncorrectable   0x0010   100   100   000    Old_age   Offline      -       0
199 UDMA_CRC_Error_Count    0x003e   200   200   000    Old_age   Always       -       0

SMART Error Log Version: 1
ATA Error Count: 2102 (device log contains only the most recent five errors)
        CR = Command Register [HEX]
        FR = Features Register [HEX]
        SC = Sector Count Register [HEX]
        SN = Sector Number Register [HEX]
        CL = Cylinder Low Register [HEX]
        CH = Cylinder High Register [HEX]
        DH = Device/Head Register [HEX]
        DC = Device Command Register [HEX]
        ER = Error register [HEX]
        ST = Status register [HEX]
Powered_Up_Time is measured from power on, and printed as
DDd+hh:mm:SS.sss where DD=days, hh=hours, mm=minutes,
SS=sec, and sss=millisec. It "wraps" after 49.710 days.

Error 2102 occurred at disk power-on lifetime: 20281 hours (845 days + 1 hours)
  When the command that caused the error occurred, the device was active or idle.

  After command completion occurred, registers were:
  ER ST SC SN CL CH DH
  -- -- -- -- -- -- --
  40 51 00 ff ff ff 0f  Error: UNC at LBA = 0x0fffffff = 268435455

  Commands leading to the command that caused the error were:
  CR FR SC SN CL CH DH DC   Powered_Up_Time  Command/Feature_Name
  -- -- -- -- -- -- -- --  ----------------  --------------------
  25 00 08 ff ff ff ef 00      01:34:32.194  READ DMA EXT
  ec 00 00 84 a9 54 a0 00      01:34:32.162  IDENTIFY DEVICE
  25 00 08 ff ff ff ef 00      01:34:30.902  READ DMA EXT
  ec 00 00 84 a9 54 a0 00      01:34:30.870  IDENTIFY DEVICE
  25 00 08 ff ff ff ef 00      01:34:29.528  READ DMA EXT

Error 2101 occurred at disk power-on lifetime: 20281 hours (845 days + 1 hours)
  When the command that caused the error occurred, the device was active or idle.

  After command completion occurred, registers were:
  ER ST SC SN CL CH DH
  -- -- -- -- -- -- --
  40 51 00 ff ff ff 0f  Error: UNC at LBA = 0x0fffffff = 268435455

  Commands leading to the command that caused the error were:
  CR FR SC SN CL CH DH DC   Powered_Up_Time  Command/Feature_Name
  -- -- -- -- -- -- -- --  ----------------  --------------------
  25 00 08 ff ff ff ef 00      01:34:30.902  READ DMA EXT
  ec 00 00 84 a9 54 a0 00      01:34:30.870  IDENTIFY DEVICE
  25 00 08 ff ff ff ef 00      01:34:29.528  READ DMA EXT
  ec 00 00 84 a9 54 a0 00      01:34:29.497  IDENTIFY DEVICE
  25 00 08 ff ff ff ef 00      01:34:28.206  READ DMA EXT

Error 2100 occurred at disk power-on lifetime: 20281 hours (845 days + 1 hours)
  When the command that caused the error occurred, the device was active or idle.

  After command completion occurred, registers were:
  ER ST SC SN CL CH DH
  -- -- -- -- -- -- --
  40 51 00 ff ff ff 0f  Error: UNC at LBA = 0x0fffffff = 268435455

  Commands leading to the command that caused the error were:
  CR FR SC SN CL CH DH DC   Powered_Up_Time  Command/Feature_Name
  -- -- -- -- -- -- -- --  ----------------  --------------------
  25 00 08 ff ff ff ef 00      01:34:29.528  READ DMA EXT
  ec 00 00 84 a9 54 a0 00      01:34:29.497  IDENTIFY DEVICE
  25 00 08 ff ff ff ef 00      01:34:28.206  READ DMA EXT
  ec 00 00 84 a9 54 a0 00      01:34:28.174  IDENTIFY DEVICE
  25 00 08 ff ff ff ef 00      01:34:26.894  READ DMA EXT

Error 2099 occurred at disk power-on lifetime: 20281 hours (845 days + 1 hours)
  When the command that caused the error occurred, the device was active or idle.

  After command completion occurred, registers were:
  ER ST SC SN CL CH DH
  -- -- -- -- -- -- --
  40 51 00 ff ff ff 0f  Error: UNC at LBA = 0x0fffffff = 268435455

  Commands leading to the command that caused the error were:
  CR FR SC SN CL CH DH DC   Powered_Up_Time  Command/Feature_Name
  -- -- -- -- -- -- -- --  ----------------  --------------------
  25 00 08 ff ff ff ef 00      01:34:28.206  READ DMA EXT
  ec 00 00 84 a9 54 a0 00      01:34:28.174  IDENTIFY DEVICE
  25 00 08 ff ff ff ef 00      01:34:26.894  READ DMA EXT
  ec 00 00 84 a9 54 a0 00      01:34:26.832  IDENTIFY DEVICE
  25 00 08 ff ff ff ef 00      01:34:25.562  READ DMA EXT

Error 2098 occurred at disk power-on lifetime: 20281 hours (845 days + 1 hours)
  When the command that caused the error occurred, the device was active or idle.

  After command completion occurred, registers were:
  ER ST SC SN CL CH DH
  -- -- -- -- -- -- --
  40 51 00 ff ff ff 0f  Error: UNC at LBA = 0x0fffffff = 268435455

  Commands leading to the command that caused the error were:
  CR FR SC SN CL CH DH DC   Powered_Up_Time  Command/Feature_Name
  -- -- -- -- -- -- -- --  ----------------  --------------------
  25 00 08 ff ff ff ef 00      01:34:26.894  READ DMA EXT
  ec 00 00 84 a9 54 a0 00      01:34:26.832  IDENTIFY DEVICE
  25 00 08 ff ff ff ef 00      01:34:25.562  READ DMA EXT
  35 00 08 ff ff ff ef 00      01:34:25.561  WRITE DMA EXT
  ec 00 00 84 a9 54 a0 00      01:34:25.529  IDENTIFY DEVICE

SMART Self-test log structure revision number 1
Num  Test_Description    Status                  Remaining  LifeTime(hours)  LBA_of_first_error
# 1  Short offline       Completed without error       00%     63731         -
# 2  Short offline       Completed without error       00%     59761         -
# 3  Short offline       Completed without error       00%     58666         -
# 4  Short offline       Completed without error       00%     53068         -
# 5  Short offline       Completed without error       00%     52647         -
# 6  Short offline       Completed without error       00%     51544         -
# 7  Short offline       Completed without error       00%     45755         -
# 8  Short offline       Completed without error       00%     42037         -
# 9  Short offline       Completed without error       00%     41661         -
#10  Short offline       Completed without error       00%     38618         -
#11  Short offline       Completed without error       00%     38613         -
#12  Short offline       Completed without error       00%     38444         -
#13  Short offline       Completed without error       00%     38444         -
#14  Short offline       Completed without error       00%     38082         -
#15  Short offline       Completed without error       00%     38082         -
#16  Short offline       Completed without error       00%     38060         -
#17  Short offline       Completed without error       00%     38059         -
#18  Short offline       Completed without error       00%     29770         -
#19  Short offline       Completed without error       00%     29770         -
#20  Extended offline    Interrupted (host reset)      00%     27849         -
#21  Short offline       Completed without error       00%     27848         -

SMART Selective self-test log data structure revision number 1
 SPAN    MIN_LBA    MAX_LBA  CURRENT_TEST_STATUS
    1  599074757  976773167  Not_testing
    2          0          0  Not_testing
    3          0          0  Not_testing
    4          0          0  Not_testing
    5          0          0  Not_testing
Selective self-test flags (0x0):
  After scanning selected spans, do NOT read-scan remainder of disk.
If Selective self-test is pending on power-up, resume after 0 minute delay.
 
Is it worthwhile to perform a long SMART test? (To rule out bad sectors.) According to the above, it should take 108 minutes. Also you mention you're seen it happen before. Was that on this unit/drive or other one(s)?

Edit1: I occasionally use the command smartctl -t long /dev/sdb during idle/off peak or overnight to perform a long SMART test.
 
Last edited:
Oh well, that's my ideas out of the window. The only things I can suggest
1. Keep an eye on SMART attribute 187 (2052) in case it increases noticeably.
2. As per your original query, anyone else have/had the same issue and what they did to resolve it.
 
Last edited:
My only hypothesis at the moment is that as the disk fills it becomes harder to find contiguous free space and that if there are too many head movements the disk buffers fill up and eventually an error can surface. But the disk isn't that full and you would expect it to be more likely when there more concurrent recordings and playback - not when there is only a single recording and no other activity.
 
Back
Top