[sysmon] System Monitoring

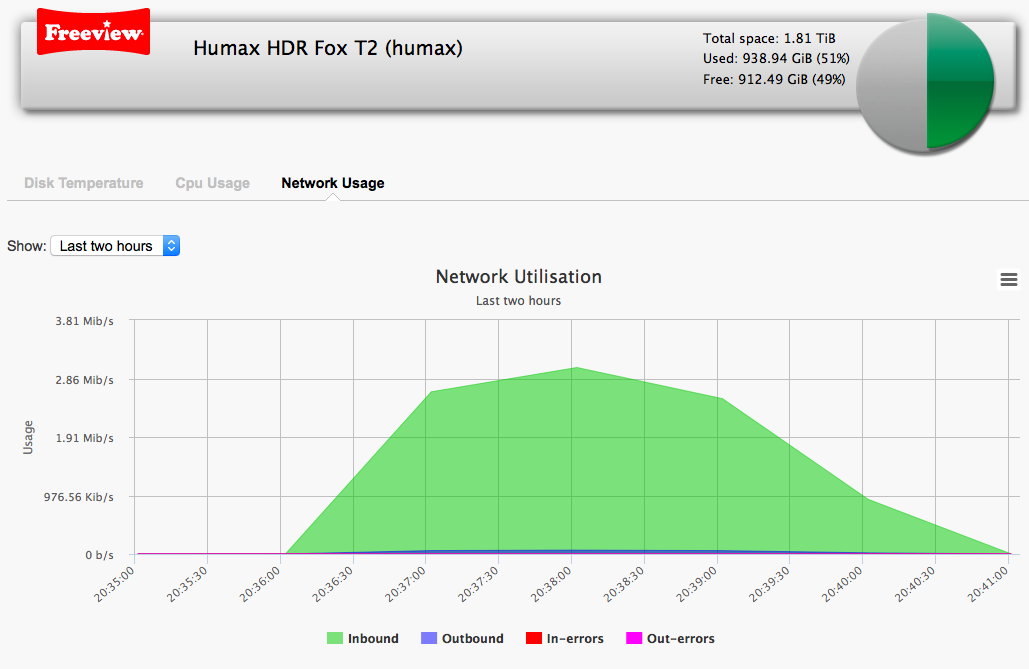
Just an idea, but is it worth monitoring the bandwidth used by the Humax box and graphing similar to CPU usage and disk temperatures?

For example, using ifconfig you get a reading received (RX) and transmitted (TX) bytes for any interface...

Code:
humax# ifconfig eth0
eth0      Link encap:Ethernet  HWaddr XX:XX:XX:XX:XX:XX
          inet addr:xxx.xxx.xxx.xxx  Bcast:xxx.xxx.xxx.xxx  Mask:255.255.255.0
          UP BROADCAST RUNNING MULTICAST DYNAMIC  MTU:1500  Metric:1
          RX packets:13409 errors:0 dropped:0 overruns:0 frame:0
          TX packets:14109 errors:0 dropped:0 overruns:0 carrier:0
          collisions:0 txqueuelen:1000
          RX bytes:1288491 (1.2 Mb)  TX bytes:3634682 (3.4 Mb)
          Interrupt:16

Some potential pitfalls...
  1. The readings from ifconfig are reset to zero when the unit is power cycled.
  2. RX and TX figures are probably an accumulation so it only gets bigger - some basic calculations would be required by the script to get a "bytes/minute" reading.
  3. Some people may be using a wireless device, so you'd have to track it for both wired and wireless devices.
Not sure if it would be useful for people or if there's anything that means it can't be done. From looking at the existing temp and cpu code, it looks like it's just running a binary from cron to get the data. So something similar could be done with ifconfig. Alternatively, there might be a better utility to do this (e.g. iftop).
 
From looking at the existing temp and cpu code, it looks like it's just running a binary from cron to get the data. So something similar could be done with ifconfig. Alternatively, there might be a better utility to do this (e.g. iftop).
It's probably better to extract the data directly by parsing /proc/net/dev
 
It's probably better to extract the data directly by parsing /proc/net/dev


Yep, you're right. This is a better way, /proc/net/dev actually gives much simpler output (easier to parse) and it's probably lower impact to query the kernel direct than to launch ifconfig to do this.
 
ifconfig of course gets its data from /proc/net/dev etc. so it's got to be better to bypass it and go direct.
 
I've just released sysmon 1.2.0 which includes a network usage graph alongside the others.
I've redone the web side of things too using a tabbed display (idea borrowed from TVDiary) making it easier and quicker to switch between graphs. There are also some improvements to the other graphs and more accurate recording of CPU utilisation.

This is the graph from my box after watching a programme from iPlayer in high-def. Not much time on the x-axis yet as I cleared the database first.

sysmon1.2.0.png
 
I think it looks really good - also think the tabs are a good idea to switch quickly between graphs.
 
I think there is a problem with my Network Usage graph, I can't boast broadband download speeds in the tens of Mib/s but the graph seems low compared to the 'Last Streamed Content' reading, which didn't fall below 5Mib/s

net-low.png


download-rate.png
 
Does that include protocol overhead?
Yes, mostly, possibly all : )

It actually depends on the network driver which in this case is Humax proprietary. The graph is taking data from /proc/dev/net which is looking at layer 2 network statistics - basically the traffic as it arrives on the wire. That means that any overhead from a higher network layer such as IP, TCP/UDP or application is included. What I'm not sure about is whether link-layer overhead is included (Ethernet headers/trailers in this case) but I'm going to do some more work to see.

The overhead on any onward connection to the Internet will be different due to the PPP framing and possibly ATM replacing Ethernet depending on your connection type.
 
Fixed in 1.2.2. It's a rendering change so the underlying data collected earlier will still be ok.

Here's a section from last night when I streamed a couple of 30 minute standard definition recordings to the HD T2 upstairs via a Foxlink mount.

Screenshot%202014-06-14%2014.14.47.png
 
I am not able to see CPU usage for two or five hours. Last day etc. works OK. Using ver. 1.2.2.


Sent from my iPad using Tapatalk
 
Some observations on consistency (or the lack thereof!) of terminology on the graph tabs and titles:

Disk Temperature / HDD Temperature
Cpu Usage / CPU Utilisation
Network Usage / Network Utilisation

I would make the titles the same as the tabs (but upper-case "Cpu").
 
For some reason my sysmon has stopped working, it just shows "Loading.....Please wait...." permanently:

Does anyone know what could cause this? - I have tried uninstalling it, rebooting, then installing again. Unfortunately, I'm not sure exactly when it started doing this, as I haven't used it for a number of weeks.

My versions:

Web interface version: 1.0.16
Custom firmware version: 3.00 (build 2137)
Humax Version: 1.02.32 (kernel HDR_CFW_3.00)

CropperCapture[1].jpg
 
OK, this is what I've tried so far:
  • Re-installed sysmon - no change
  • Forced re-install of webif - no change
  • fix-disk via maintenance mode - no change
  • I noticed that /mod/monitor/monitor.db didn't have a recent modified date, so I removed sysmon, deleted /mod/monitor & /mod/webif/plugin/sysmon to clean it up, rebooted, installed sysmon, rebooted again. I can now see monitor.db getting modified every minute, and the crontab entry is OK, but I still have the Loading.....Please Wait issue.
Anything else that could be causing this?
 
Back
Top