[webif] Web Interface version 1.0.18 released

Status
Not open for further replies.

af123

Administrator
Staff member
I have released version 1.0.18 of the custom firmware web interface. This rolls up all of the incremental changes which were released as updates to 1.0.17 so you may well have already seen some of these changes:

1.0.18 (05/12/2014)
  • New disk space pie chart at top right;
  • Include dustbin size;
  • Introduce new hooks into media browser (for plugins to use);
  • Show .m4v files in media browser;
  • Allow sorting of diskspace summary screen;
  • Improve scheduling through the web interface. Now includes events from other channels in the same way that the standard Humax software does;
  • Backups now include the raw scheduled events;
  • Don't include TSR space in diskspace calculations if TSR isn't present;
  • Improve package repository connectivity check - now checks HTTP connectivity rather than ping;
  • Don't require repository connectivity to remove packages.
 
I've also released an update, 1.0.18-1, which provides a new log viewer through the diagnostics page. At present this can only show the last 5000 lines of any log file (use FTP for anything bigger!) but it allows easy paging through the log file and filtering to just show lines of interest. It's working well for me with all the browsers I have available but I'd appreciate if people could give it a try and see if it works for them. Please provide feedback and suggestions. Thanks.
 
I had a quick look at the new log file viewer, I found the 'Highlight' option to display an entered keyword in Yellow in the displayed page (very useful BTW) , but I couldn't find the filter to just show lines of interest, am I missing something?
 
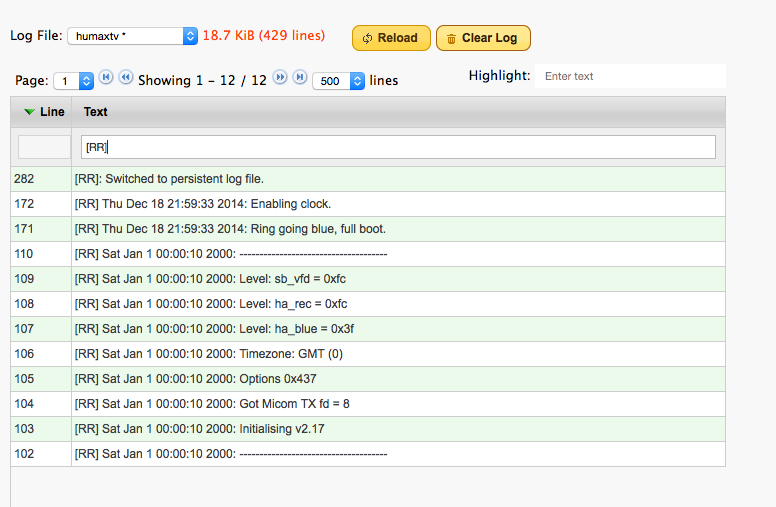
You just type the text in the cell at the top of the table and it displays the matching lines. Most browsers will display a placeholder there saying 'Search log'. Here my log is 429 lines long but only 12 lines contain the redring log tag.

Screenshot%202014-12-18%2023.38.15.png
 
I've also released an update, 1.0.18-1, which provides a new log viewer through the diagnostics page... Please provide feedback and suggestions.
I don't like the way the leading space gets removed from the lines. I find the top to bottom default annoying as well, especially as it forgets it when you change files.
 
Am I doing something wrong? No matter what log file I choose, the new viewer page just sits there saying "Loading....", indefinitely. Even for a one-line log file with 13 bytes. thanks...

Web interface version: 1.0.18-2
Custom firmware version: 2.23 (build 2035)
Humax Version: 1.03.12 (kernel HDR_1.02.32)
 
af123 : You just type the text in the cell at the top of the table and it displays the matching lines. Most browsers will display a placeholder there saying 'Search log'.
Sorry, I'm not being very observant, I have added it to the WiKi notes HERE
 
I don't like the way the leading space gets removed from the lines. I find the top to bottom default annoying as well, especially as it forgets it when you change files.
I miss the old list as well, where you could see the pathnames and the sizes of the files (to see if there was anything worth investigating). Now you have to laboriously click through each one to find out whether it's empty or not. What does the * on the name mean?
I don't like the default of 10 lines either. It's ridiculously small, so yet another thing to have to click on (although it does seem to remember that between files).
 
The default number of lines should be 50 and it should stick once you change it.. I think the 10 has come in while it was broken.
Leading spaces - fixed;
Default sorting order.... one for discussion but I could probably make it stick once changed;
* means that it's a volatile log (doesn't survive a reboot). Not sure how useful that is.
I can show sizes along with the log names if it's helpful - not sure that pathname adds much though but open to persuasion.
 
We seem to have lost the ability to delete individual logs from the "View Log Files" list on the Diagnostics page. Now it seems as though you have to select each log file individually to view it, before you can select "Clear Log".
 
We seem to have lost the ability to delete individual logs from the "View Log Files" list on the Diagnostics page. Now it seems as though you have to select each log file individually to view it, before you can select "Clear Log".
True. Is that something that you'd like back?
 
Mediatomb and Transmission have disappeared from the Services list, but NFS hasn't, even though all are not installed on the box in question.
Is this expected?
I added them back and also added "ntp" as per this thread:
Code:
humax /mnt/hd2/mod/etc/modservice.d # cat ntp
key=/mod/bin/ntpclient
rc=90ntpclient
proc=/mod/bin/ntpclient
humax /mnt/hd2/mod/etc/modservice.d # cat transmission
key=/mod/sbin/transmission-daemon
rc=80transmission
proc=/mod/sbin/transmission-daemon
humax /mnt/hd2/mod/etc/modservice.d # cat mediatomb
key=/mod/mediatomb/start
rc=90mediatomb
proc=/mod/mediatomb/sbin/mediatomb

Edit: Oh, I see the files in /mod/etc/modservice.d are now part of the relevant package. Except that is for cifs, nfs, samba. Why the mixture?
 
Last edited:
I don't maintain the cifs, nfs and samba packages so they haven't been updated yet. The idea is that each package should deliver its own service file.
 
Dustbin display issue with version 18.3 running on Google Chrome in Windows 8...

Hi, I have just upgraded webif to 1.0.18-3 and have a display issue with the new dustbin pie chart. When using Google Chrome, the pie chart appears at the top left of the screen and is very large, when using Internet Explorer, it appears in the top right as expected. Has anyone else encountered this? Please see screenshot below.

upload_2014-12-22_14-55-0.png


Web interface version: 1.0.18-3
Custom firmware version: 3.00 (build 2137)
Humax Version: 1.03.12 (kernel HDR_CFW_3.00)
 
Just clear your browser cache in Chrome, or simply refresh the page (F5 key). That's all it needs.
 
Last edited:
The log viewer is now working for me, albeit slowly about 20 seconds to process a log 173.37 KiB (2414 lines)

The major problem I see with the new filter is that there appears to be no easy way to selectively expand sections of hidden lines so that I can see the context and what else was going on at the time.

For example using the Detectads log file I can easily filter to find the portion of log relating to Midsomer Murders but I can't see all the detailed messages about where it found ad breaks in the program:
upload_2014-12-22_17-14-54.png

What we need is an option, possibly a twisty or +, on the hidden lines to allow them to be shown/hidden or alternatively an option to show a number of lines either side of each matched line.
 
Status
Not open for further replies.
Back
Top